“Life’s a bit like mountaineering – never look down.” –Sir Edmund Hillary
July is one of those months that seem to define summer. It’s hot, which typically means a lot of pool or beach days. We’ve got a major holiday in it, complete with the classic summertime vibes of grilled meat and adult beverages. We haven’t quite turned the corner into vacation-land August, where you wake up and find that the empty streets of your hometown suddenly make you feel like you’re on a sci-fi movie set. Typically in July in the financial markets there is a slowing down; not the complete slowdown of August, but a kind of tapping of the brakes. If anything defines the past two years however, it is that they are anything but “typical.” Of course this includes financial markets, where much like another summertime event, the simple walking of the boardwalk at a carnival, we continue to bear witness to the unusual and the unexplained.
Since third quarter 2021, we have heard the steady drumbeats of inflation. A few times over that period of time, it seemed like a horror movie, where inflation took on a life of its own. Every time we thought we might get a reprieve, a new print would be published and it seemed to be coming back stronger and bigger. With the Fed on the defense and trying to play catch-up, we saw the 2 year treasury yield pushed higher and higher as the market forced the Fed not only to act but start attacking what it saw as being uncontrollable.
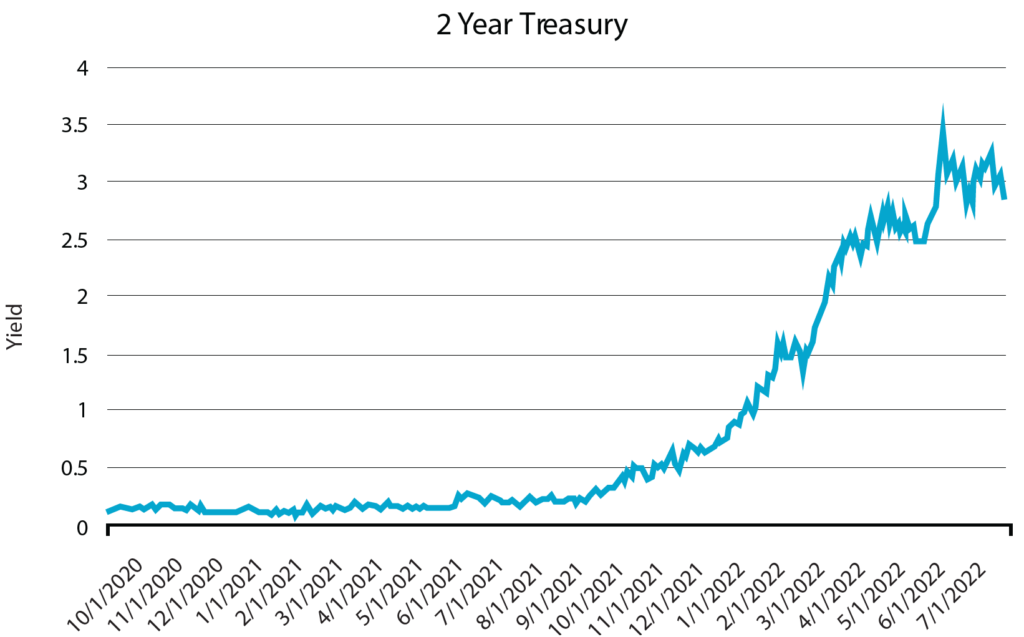
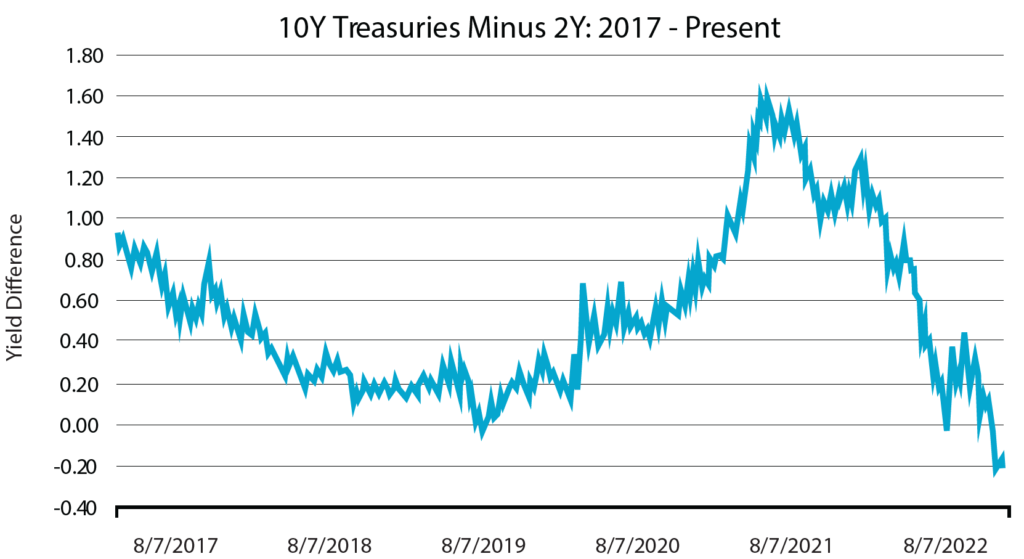
About six months ago, there was a concern that the Fed was reacting too harshly and that there was a chance that the rate hikes combined with a slowing economy was going to push us into a recession. All of which meant that if the market was right, once the rate hikes ended, we just as quickly should expect some rate cuts. All of this translated into an inverted yield curve, with the 10 year treasury at end of July 2022 yielding 2.65% and the 2 year treasury yielding 2.88%.
This type of inversion is even more atypical, given that we can see a similar pattern if we simply look at three month LIBOR, where the 10 year treasury was yielding 2.65% compared to 2.79%.
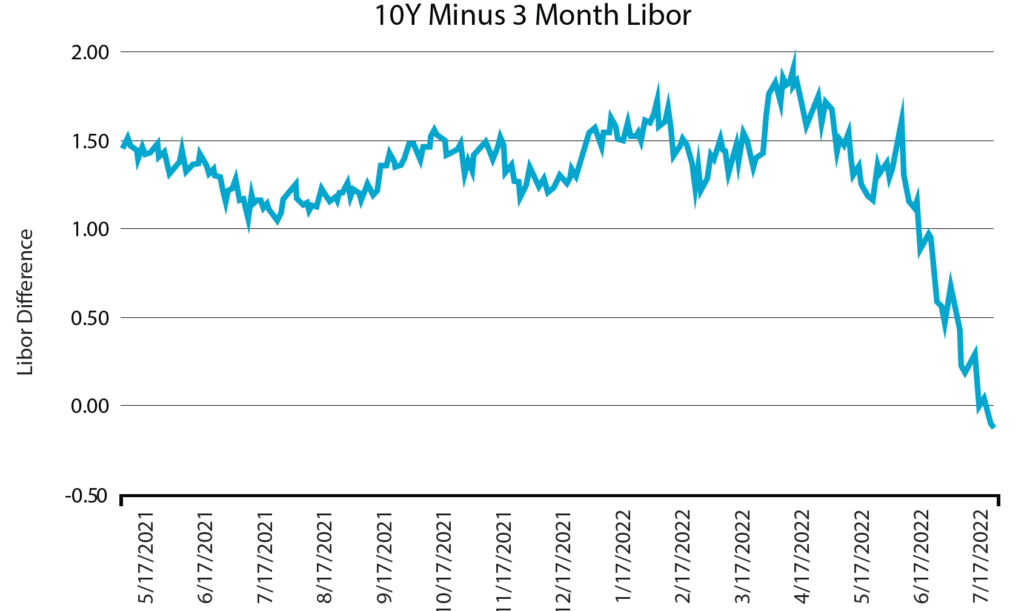
This type of movement and the inversion of the curve has been reported on a great deal. It is an odd moment for the financial markets, representing concerns about high inflation leading right into recession. Movement like this can also lead to much strategizing as one seeks to take advantage of the curve, with plenty of debate on not only what that is telling the markets about the current state of the economy but also future risks, which can also then push credit spreads around and influence the risk appetite of the overall investor base. In other words, there is a lot to think about simply by how the curve has inverted. The equity markets seem to be ignoring the messages of this inversion, the bond markets not so much. Large investors are ignoring the euphoria emanating from the stock pickers, and instead are focusing on how these types of expectations surely indicate a slowing economy and a potential risk-off mode overtaking the market, leading to ever widening credit spreads, especially in high yield.
This type of message buried in the curve not only provides us opportunities at certain maturity points in the curve, but also leads us to move the portfolio in a manner to anticipate what future credit risks might look like on the horizon. That is what the front end is telling us.
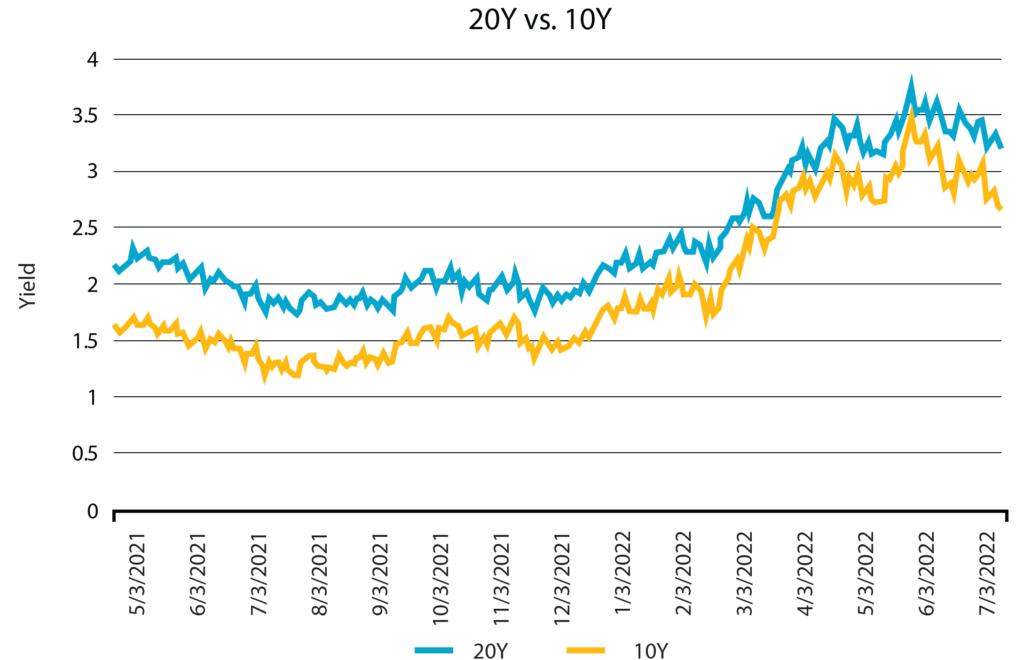
Less discussed is the other inversion point hiding within the yield curve. Represented in the chart below is the yield for the 20 year treasury over the past two years. As one can see, it has moved in a similar fashion year over year.
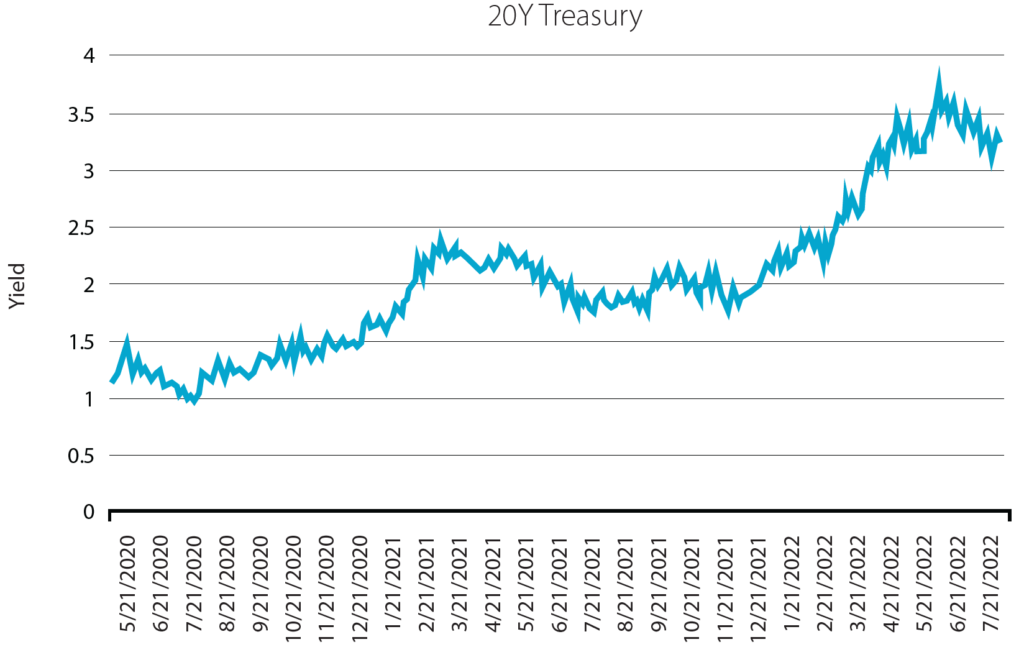
And in fact this part of the yield curve, from the 10 year to the 20 year, looks as one might expect a normal yield curve to look, with additional yield being required due to longer maturity risk.
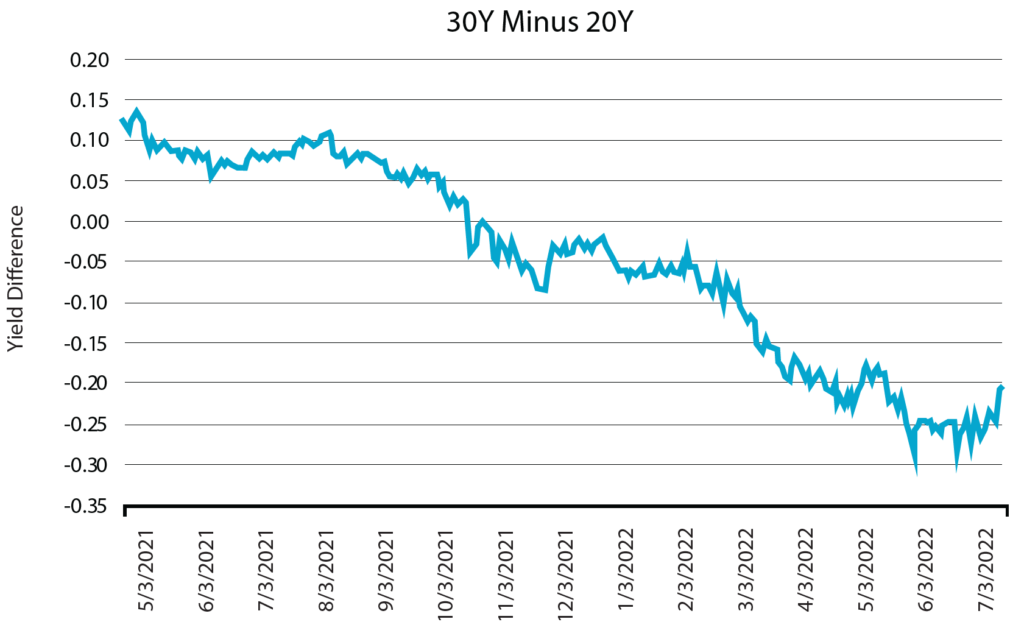
However, when we look at the 20 year versus the 30 year, we see the inversion, similar to that illustrated between the 10 year and the 2 year.
Admittedly, the 20 year is a bit of an odd duck. It is a relatively new treasury maturity bond added to the mix and as such, the investor base is still developing. As seen below, the infrequencies of the issuance times is to the point that when it is issued, the announcement news itself is newsworthy. To be sure, it is not issued on a routine basis, especially when compared to the 2 year, 10 year or the 30 year treasury.
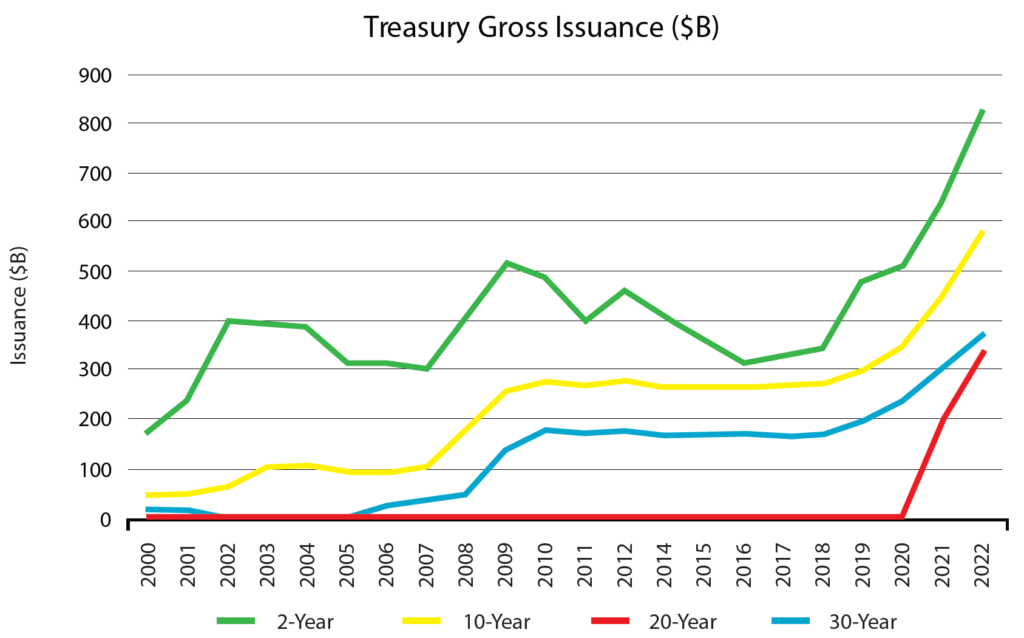
Because of the special circumstances in terms of the issuance and smallish investor base of the 20 year treasury, what it tells the market in terms of health and expectations remains fairly limited. Of late, most investors have painted it simply as a sort of ripple or a bias being expressed in response to central banks actions or reactions to current economic conditions. In this case, a sort of ripple from the central banks aggressively combating inflation on the front end and then a delayed reversion to growth beyond the 10 year, which over time should mean a steepening.
Nevertheless, because of the infrequency of the issuance, the message of that area of the curve can be murky. And generally when things are not so clear, or there is some confusion over the message, there can be room for opportunities.
Issuers tend to focus on issuing into certain maturities. Typically that can include discussions with their dealer syndicate as to where investors might be focused, but also, importantly, finding a targeted area for an issuer that presents the ideal spot for issuance representing the most efficient in terms of projected cash needs, advantageous interest rates, and a desire to ladder their debt so as to not create a future issue in terms of having too much maturating in a given period and thereby creating a potential stress on liquidity several years out. Additionally, certain investor types simply have targeted maturity areas. Some of those can include a fund’s investment targets due to the type of fund it is or in other cases, such as life insurance company, a desire to more closely align asset-liability targets.
Targeting those issuers, understanding the investor base, and then finding a spot on the yield curve, such as the 20 year area where the inversion seems highlighted and the murkiness of the message tends to push certain demand away, can help create the types of opportunities one can take advantage of to create overperformance in the future. And right now that is the type of targeted opportunity that interests us. The key to that is not only finding that moment and spot, but also being able to ascertain the proper targets in that area. With the 20 year maturity spot currently ripe with opportunities, we have found it recently to be a good spot to nimbly move amongst certain highly liquid, desired credits, which now, due to the rate movement have become attractive in terms of levels. In the past, many of these issuers because of their highly liquid nature and desired names were simply too expensive and there was limited upside. Now however, because of the sell-off in rates, the widening of credit spreads, and the murkiness of the message buried within the 20 year maturity area, we see ample targets that should lead to near-term overperformance.
The messages buried within the inversion points in the yield curve are telling and should lead the knowledgeable investor to find value and opportunity simply by paying attention. Sometimes that message is easier to decipher, such as that which we see on the shorter end of the curve. But just as important, sometimes that type of inversion point can also lead one to find inefficiencies, and while it may be less popular due to market conditions, can lead to overperformance in the near term as well. Even on the yield curve, sometimes it can pay simply by looking up.
Definition of Terms
Basis Points (bps) – refers to a common unit of measure for interest rates and other percentages in finance. One basis point is equal to 1/100th of 1%, or 0.01%, or 0.0001, and is used to denote the percentage change in a financial instrument.
Curvature – A yield curve is a line that plots yields (interest rates) of bonds having equal credit quality but differing maturity dates. The slope of the yield curve gives an idea of future interest rate changes and economic activity.
Mortgage-Backed Security (MBS) – A mortgage-backed security is an investment similar to a bond that is made up of a bundle of home loans bought from the banks that issued them.
Collateralized Loan Obligation (CLO) – A collateralized loan obligation is a single security backed by a pool of debt.
Commercial Real Estate Loan (CRE) – A mortgage secured by a lien on commercial property as opposed to residential property.
CRE CLO – The underlying assets of a CRE CLO are short-term floating rate loans collateralized by transitional properties.
Asset-Backed Security (ABS) – An asset-backed security is an investment security—a bond or note—which is collateralized by a pool of assets, such as loans, leases, credit card debt, royalties, or receivables.
Option-Adjusted Spread (OAS) – The measurement of the spread of a fixed-income security rate and the risk-free rate of return, which is then adjusted to take into account an embedded option.
Enhanced Equipment Trust Certificate (EETC) – One form of equipment trust certificate that is issued and managed through special purpose vehicles known as pass-through trusts. These special purpose vehicles (SPEs) allow borrowers to aggregate multiple equipment purchases into one debt security
Real Estate Investment Trust (REIT) – A company that owns, operates, or finances income-generating real estate. Modeled after mutual funds, REITs pool the capital of numerous investors.
London InterBank Offered Rate (LIBOR) – a benchmark interest rate at which major global banks lend to one another in the international interbank market for short-term loans.
Secured Overnight Financing Rate (SOFR) – a benchmark interest rate for dollar-denominated derivatives and loans that is replacing the London interbank offered rate (LIBOR).
Delta – the ratio that compares the change in the price of an asset, usually marketable securities, to the corresponding change in the price of its derivative.
Commercial Mortgage-Backed Security (CMBS) – fixed-income investment products that are backed by mortgages on commercial properties rather than residential real estate.
Floating-Rate Note (FRN) – a bond with a variable interest rate that allows investors to benefit from rising interest rates.
Consumer Price Index (CPI) – a measure that examines the weighted average of prices of a basket of consumer goods and services, such as transportation, food, and medical care. It is calculated by taking price changes for each item in the predetermined basket of goods and averaging them.
Net Asset Value (NAV) – represents the net value of an entity and is calculated as the total value of the entity’s assets minus the total value of its liabilities.
S&P 500 – The Standard and Poor’s 500, or simply the S&P 500, is a stock market index tracking the stock performance of 500 large companies listed on exchanges in the United States.
German DAX – The DAX—also known as the Deutscher Aktien Index or the GER40—is a stock index that represents 40 of the largest and most liquid German companies that trade on the Frankfurt Exchange. The prices used to calculate the DAX Index come through Xetra, an electronic trading system.
NASDAQ – The Nasdaq Stock Market (National Association of Securities Dealers Automated Quotations Stock Market) is an American stock exchange based in New York City. It is ranked second on the list of stock exchanges by market capitalization of shares traded, behind the New York Stock Exchange.
MSCI EM Index – The MSCI Emerging Markets Index captures large and mid cap representation across 24 Emerging Markets (EM) countries. With 1,382 constituents, the index covers approximately 85% of the free float-adjusted market capitalization in each country.
Nikkei – The Nikkei is short for Japan’s Nikkei 225 Stock Average, the leading and most-respected index of Japanese stocks. It is a price-weighted index composed of Japan’s top 225 blue-chip companies traded on the Tokyo Stock Exchange.
Shanghai Composite – is a stock market index of all stocks (A shares and B shares) that are traded at the Shanghai Stock Exchange.
MOVE Index – The ICE BofA MOVE Index (MOVE) measures Treasury rate volatility through options pricing.
VIX Index – The Cboe Volatility Index (VIX) is a real-time index that represents the market’s expectations for the relative strength of near-term price changes of the S&P 500 Index (SPX).
Dow Jones Industrial Average – The Dow Jones Industrial Average is a price-weighted average of 30 blue-chip stocks that are generally the leaders in their industry.
Hang Seng – The Hang Seng Index is a free-float capitalization-weighted index of a selection of companies from the Stock Exchange of Hong Kong.
STOXX Europe 600 – The STOXX Europe 600, also called STOXX 600, SXXP, is a stock index of European stocks designed by STOXX Ltd. This index has a fixed number of 600 components representing large, mid and small capitalization companies among 17 European countries, covering approximately 90% of the free-float market capitalization of the European stock market (not limited to the Eurozone).
Euro STOXX 50 – The EURO STOXX 50 Index is a market capitalization weighted stock index of 50 large, blue-chip European companies operating within eurozone nations.
CAC (France) – is a benchmark French stock market index. The index represents a capitalization-weighted measure of the 40 most significant stocks among the 100 largest market caps on the Euronext Paris (formerly the Paris Bourse).
Duration Risk – the name economists give to the risk associated with the sensitivity of a bond’s price to a one percent change in interest rates.
Federal Open Market Committee (FOMC) – the branch of the Federal Reserve System (FRS) that determines the direction of monetary policy specifically by directing open market operations (OMO).
United States Treasury (UST) – the national treasury of the federal government of the United States where it serves as an executive department. The Treasury manages all of the money coming into the government and paid out by it.
High Yield (HY) – high-yield bonds (also called junk bonds) are bonds that pay higher interest rates because they have lower credit ratings than investment-grade bonds. High-yield bonds are more likely to default, so they must pay a higher yield than investment-grade bonds to compensate investors.
Investment Grade (IG) – an investment grade is a rating that signifies that a municipal or corporate bond presents a relatively low risk of default.
Exchange Traded Fund (ETF) – an exchange traded fund (ETF) is a type of security that tracks an index, sector, commodity, or other asset, but which can be purchased or sold on a stock exchange the same as a regular stock.
Federal Family Education Loan Program (FFELP) – a program that worked with private lenders to provide education loans guaranteed by the federal government.
Business Development Program (BDC) – an organization that invests in small- and medium-sized companies as well as distressed companies.
Control #: 15513710-UFD-8/18/2022


